Private Credit
Aiming to enhance portfolio yield and diversification
Summary
- Private credit funds offer traditional public fixed income investors a means to dramatically expand their investment opportunity set and potentially enhance the yield profile of their portfolios.
- These funds are, however, far less liquid than traditional mutual funds and ETFs. The process to source, screen, underwrite, and collect interest and principal on private loans takes time. These do not trade publicly and are intended to be held to maturity. To capture the potential benefits, investors need a long-term horizon.
- Although there is a broad range of managers and strategies available, investors may face challenges accessing and evaluating the best options to meet their needs. Working with a scaled global asset manager that has institutional experience in these fields can help investors build a high-quality private credit allocation with institutional caliber governance and oversight.
Expanding investment opportunities
Private credit funds offer traditional public fixed income investors a means to significantly expand their investment opportunity set and and potentially enhance the yield profile of their portfolios.
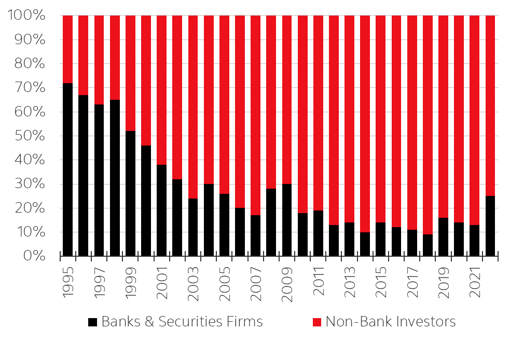
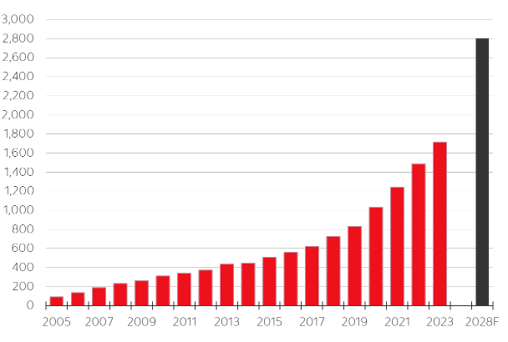
Investing in private credit has grown in relevance over the past couple of decades as the market has grown from roughly $100 billion of assets under management in 2005 to over $1.7 trillion at June 2023. It is expected to surpass $2 trillion by 2028. The growth of this market has been fueled by two key drivers: (1) the reduced participation of banks in the middle market loan market (Fig. 1 LHS), and (2) the rapid growth of the private equity industry and the associated need to finance their transactions (Fig. 1 RHS).
Figure 1. LHS: Reduced participation of banks in loan market, RHS: Growth of private equity industry


Prior to the Great Financial Crisis, banks were the primary lenders to mid-sized private businesses in the U.S., but as bank consolidation and regulation has increased, they have pulled back lending and have been replaced by non-bank lenders such as asset management firms and insurance companies.
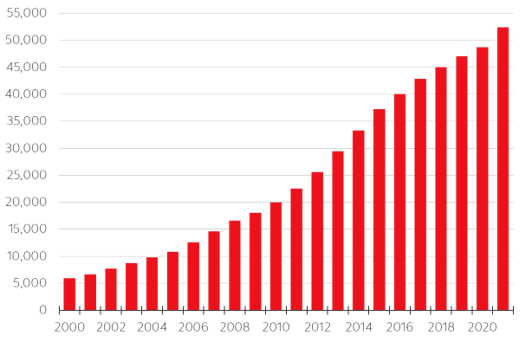
At the same time, the number of private equity owned companies in the U.S. has increased tenfold (Fig. 2 LHS). The demand for private capital solutions - both debt and equity - has grown from businesses who prefer to remain private, and work with a smaller number of active shareholders and credit solution providers. The supply of private capital from investors (initially from large institutions and now from individual investors) has also increased to meet this demand. On the credit side, investors have been attracted by the strong absolute and risk adjusted yield properties of the asset class.
Figure 2. LHS: growth of private backed companies, RHS: Price volatility and return statistics


+3.9%
Return Premium vs. Public Market Equivalent Index
The private credit market in the U.S. is largely focused on established mid-sized companies with $10 million to $1 billion in annual revenues. This segment consists of approximately 200,000 private companies that represent 1/3 of the private sector Gross Domestic Product (GDP).
Historically, private credit has outperformed high yield bonds and broadly syndicated loans (the closer public market equivalent) by 2.3% and 3.9% with less volatility. They are mostly sub-investment grade, high income investments that pay out quarterly distributions but don’t produce much capital gains. Private credit is also mostly floating rate, which means it is not subject to capital losses (or gains) as interest rates fluctuate. This offers an element of diversification relative to more traditional fixed rate forms of credit, which are more broadly held by investors than floating rate credit.
Excess returns here can be explained by the higher rates borrowers are willing to pay for the certainty and speed of execution that private credit funds provide versus traditional investment banking channels, which typically take more time, involve more third parties, and which may not come through when market conditions are challenging. Private lenders are also positioned to provide more bespoke financing solutions for a wider range of borrowers and demand stricter lender protections in the form of covenants. Private credit funds also typically use forms of leverage that are absent in traditional fixed income strategies.
The methodologies used to value private assets are generally less susceptible to short term swings in market sentiment that can drive higher price volatility in publicly traded assets. Private assets are valued much less frequently than their public equivalents, and often with a considerable lag.
Fundamental differences in the investment process combined with longer time horizons required to harvest the potential benefits of private market investments are all factors that contribute to an “illiquidity premium” investors in these strategies have generally earned in the past and continue to expect in the future.
Scotia Global Asset Management® is a provider of global investment management solutions and is a registered trademark of The Bank of Nova Scotia, used under license. Scotia Global Asset Management includes the following subsidiaries of The Bank of Nova Scotia: 1832 Asset Management L.P. (Canada), Scotia Administradora General de Fondos Chile S.A (Chile), Scotia Fondos Sociedad Administradora de Fondos Mutuos S.A. (Peru), Scotia Fondos S.A. de C.V. (Mexico), Sociedad Operadora de Fondos de Inversión Grupo Financiero Scotiabank Inverlat (Mexico), Scotiabank & Trust (Cayman) Ltd. (Cayman Islands), and Scotia Investments Jamaica Limited (Jamaica).
Scotia Global Asset Management’s broad range of investment management solutions are also made available through its affiliates and distribution partners. These include: Jarislowsky, Fraser Limited, MD Financial Management Inc. and MD Management Limited, Tangerine Investment Funds Limited, Private Investment Counsel, a service of 1832 Asset Management L.P., Scotia Capital Inc., Scotia Securities Inc., Scotiabank Inverlat, S.A., Institución de Banca Múltiple, Grupo Financiero Scotiabank Inverlat, Scotia Inverlat Casa de Bolsa, S.A. de C.V., Scotiabank Chile S.A., Scotia Administradora General de Fondos Chile S.A, The Bank of Nova Scotia Jamaica Limited, Scotiabank & Trust (Cayman) Ltd and other affiliates of The Bank of Nova Scotia.
This publication has been prepared by Scotia Global Asset Management. It is for general information purposes only and should not be considered or relied upon as personal and/or specific financial, tax, pension, insurance, legal or investment advice. We are not tax or legal advisors, and we recommend that individuals consult with their qualified advisors, including tax and legal advisors, before taking any action based upon the information contained in this publication. The opinions and projections contained in this publication are our own as of the date hereof and are subject to change without notice. Scotia Wealth Management is under no obligation to update this publication and readers should assume the information contained herein will not be updated. While care and attention has been taken to ensure the accuracy and reliability of the material in this publication, neither The Bank of Nova Scotia nor any of its affiliates or any of their respective directors, officers or employees make any representations or warranties, express or implied, as to the accuracy or completeness of such material and disclaim any liability resulting from any direct or consequential loss arising from any use of this publication or the information contained herein. This publication may contain forward-looking statements based on current expectations and projections about future general economic factors. Forward-looking statements are subject to inherent risks and uncertainties which may be unforeseeable and such expectations and projections may be incorrect in the future. Forward-looking statements are not guarantees of future performance and you should avoid placing undue reliance upon them. This publication and all the information, opinions and conclusions contained herein are protected by copyright. This publication may not be reproduced in whole or in part without the prior express consent of The Bank of Nova Scotia.
© Copyright 2025 The Bank of Nova Scotia. All rights reserved.


